Groundwater Elevation and Contaminant Levels, Correlation, or Causation.How can you tell?
Groundwater Elevation and Contaminant
Levels, Correlation, or Causation.
How can you tell?
"The obvious is that which is never seen until someone
expresses it simply." -Kahlil Gibran
Over the years I've heard a lot of explanations regarding groundwater elevations and subsequent increases and/or decreases in contaminant levels and the presence and disappearance of free product. I've heard people argue that increasing water levels increase contamination, and I've also heard the opposite. Some people believe that increasing water levels causes free product to disappear and that decreasing levels cause it to re-appear (which is counter-intuitive to a lay person). The question or debate is (all other things being equal): does groundwater elevation have an effect on contaminant levels? Furthermore, does groundwater elevation have an effect on the presence or absence of free product? These are a question of correlation or causation.
I've been doing this kind of work for about 26 years now, and I've learned enough to know that it all depends on the specific site and even the specific well.
Webster's Dictionary defines correlation as: "a relation existing between phenomena or things or between mathematical or statistical variables which tend to vary, be associated, or occur together in a way not expected on the basis of chance alone." Webster's defines causation as: "the relationship between an event or situation and a possible reason or cause."
Determining correlation, 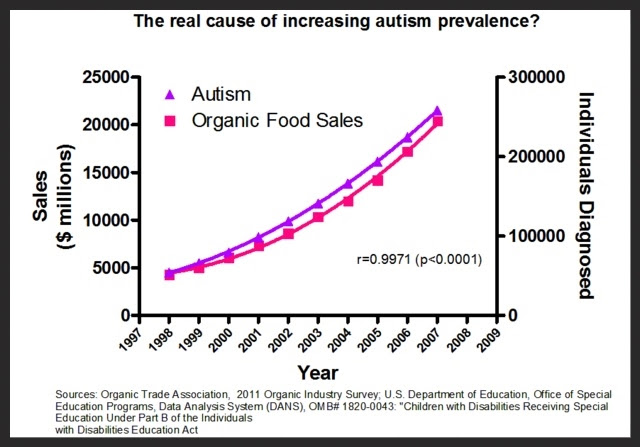 in most cases, is pretty simple. We tend to use graphs to visually plot and identify correlations. In the example to the right, you can see a strong correlation between the two variables; however, the graph implies a causation, which is ridiculous. Organic food doesn't cause autism. It was Mark Twain who said, "There are lies, damned lies and statistics." Determining causation requires a bit more thought and reason, and can be tricky to plot on a graph.
in most cases, is pretty simple. We tend to use graphs to visually plot and identify correlations. In the example to the right, you can see a strong correlation between the two variables; however, the graph implies a causation, which is ridiculous. Organic food doesn't cause autism. It was Mark Twain who said, "There are lies, damned lies and statistics." Determining causation requires a bit more thought and reason, and can be tricky to plot on a graph.
With regards to groundwater
 |
| Graph A |
elevation and contamination, in Graph A you can see that groundwater contamination seems to go up and down in concert with the groundwater elevation. This is a strong correlation which implies causation. However, in Graph B, the correlation appears to be the exact opposite. Contaminant levels seem to go down with increasing groundwater elevations. The two causation conclusions implied by the graphs seem to
 |
| Graph B |
conflict with each other. One of the interesting things about the data from these two wells is that they are taken from the same site across the same date range.
The explanation for the differing correlations is that one well is located in a source area and the higher groundwater elevations expose the groundwater to remaining residual source material in the soils and capillary fringe. This exposure thus causes increased contaminant leaching and migration to the groundwater. The down gradient well is subject to the dilution effects of the increase in clean water entering the aquifer at that well location.
The point of this article is not to argue the significance of these effects or whether there is any other explanation as to the cause, but instead to illustrate that simply visualizing the data correlations is important in evaluating and eventually determining causation. In this example case, seeing the correlation of the source well increase as compared to the down gradient well decrease, made it obvious source soil material existed. It was determined that the presence of existing source soils needed to be investigated and removed, which it was.
In the case of the free product, being able to see the interaction of groundwater elevations and presence of absence of free product is also important. One often overlooked but equally important feature is the intersection of the groundwater
 |
| Graph C |
interface within the well's screened interval. If the screen is submerged completely beneath the groundwater interface, free product cannot flow into the well, giving the unaware project manager the impression that free product is not present at this well location. In the Graph C, the black line represents the top of the well, the orange line represents the bottom of the well and the blue line represents the groundwater elevation. The only opportunity for product to flow into this well is on 11-21-2008, when water elevation was beneath the top of the screened interval. In the event that this well had free product, you would see a red line on top of the blue water table elevation line. These types of graphs are quick and effective at illustrating information like this.
If you have high contaminant concentrations in groundwater, you may have free product in your source soils, but if your screens are too deep, then you will not see that free product and may actually think you don't have any. I've seen this mistake many, many times. These types of visual graphs quickly and effectively illustrate whether your screen placement prevents the identification of the presence of free product. Additionally, the correlation of groundwater elevation, up or down, and the presence of free product can also be quickly identified.
Good graphics allow a project manager to not only determine correlations and thereby conclude causation; it also allows a good project manager to convey that information and conclusions in a simple fashion to a client or a regulator.
All these graphics can be generated using existing site data in about 3-5 seconds using SampleServe's groundwater project management application. Using traditional methods such as Excel would take several hours.
To learn more about our groundwater project management application and how you can use it for your own projects go to SampleServe.com.
- Russell Schindler


These contaminations are all caused by improper waste disposal, we should do our share in helping this could not happen; if only there's a way to stop the already contaminated areas. Anyways, graphs are very useful when it comes to analysis and decision. I hope you will offer this for free? Anyhow, thanks for sharing.
ReplyDelete